Scatter graph option for QCs
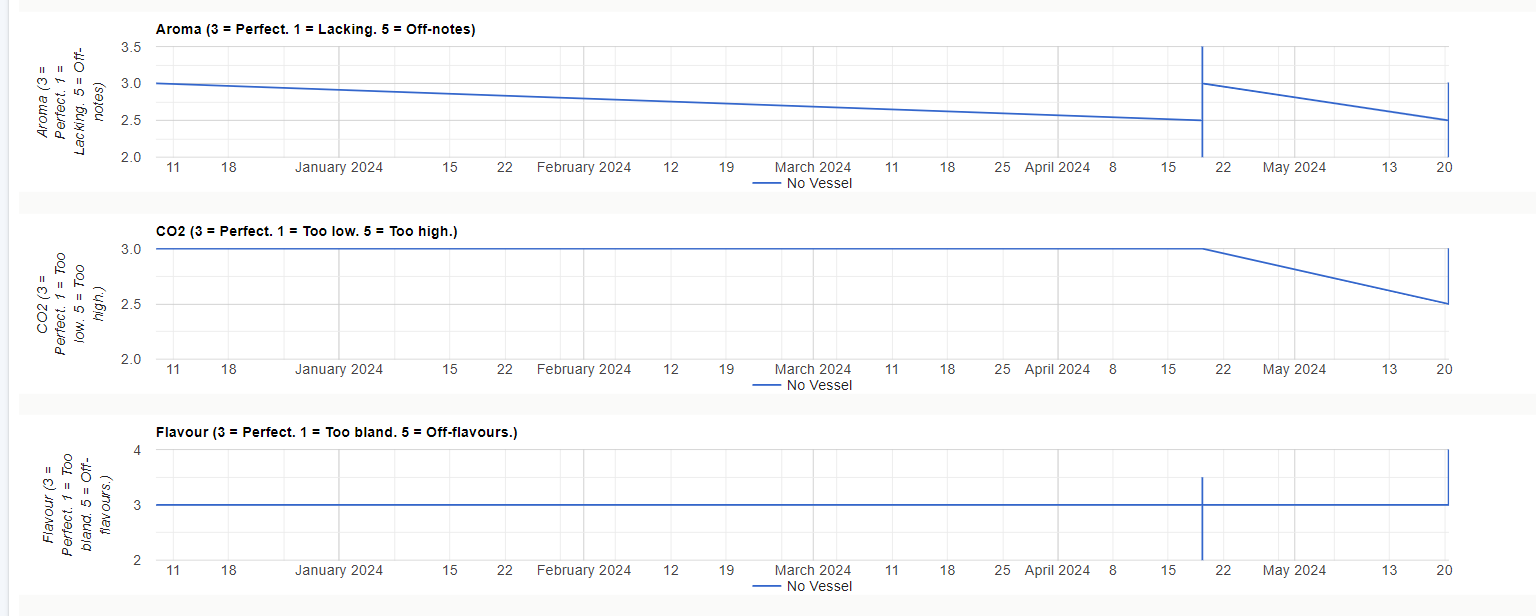
We are logging multiple tasting feedback forms from different tasters, sometimes months and sometimes seconds apart. The data is subjective and potentially a bit noisy. With the current point-to-point plot, it is difficult to interpret these.
It would be great if these points could be a scatter graph with a trend line.
Loading content, please wait...
Loading content, please wait...
Loading content, please wait...
Loading content, please wait...
Loading content, please wait...
Loading content, please wait...
Loading content, please wait...
Loading content, please wait...
Loading content, please wait...
Loading content, please wait...
Loading content, please wait...
Loading content, please wait...